Seattle Air Quality: Complete Guide to Pollution and Safety
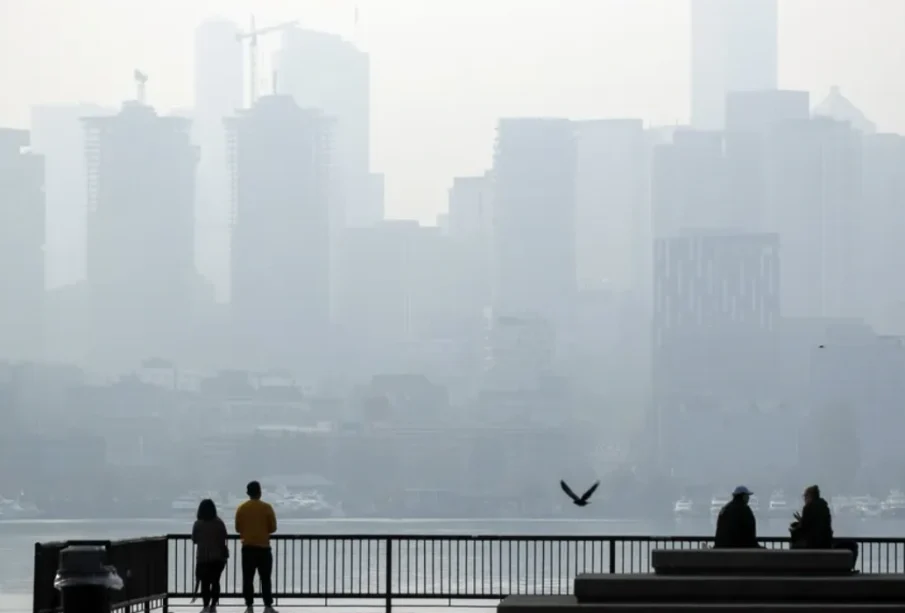
Credit: Kevin Clark / The Seattle Times
Air quality is an important public health and environmental well-being concern, especially in large cities such as Seattle. Even though Seattle is known for being green, the air quality has deteriorated since 2016, with the city repeatedly missing federal goals for unhealthy air pollution days. This guide tries to present a detailed summary of Seattle’s air quality, Washington, covering many different aspects of air pollution in the Emerald City. It is imperative that people living in and visiting Seattle Washington understand the dynamics of Seattle air quality and its implications, particularly regarding the Seattle air quality index and the larger Puget Sound air quality.
Introduction & Current State
Seattle often presents a paradox when it comes to air quality. While the city consistently shows “Good” Air Quality Index (AQI) ratings on most days of the year, the American Lung Association notably gave Seattle an “F” grade for both ozone and particle pollution in 2020. This discrepancy highlights a complex reality: while the average air quality might seem satisfactory, specific days with very high pollution levels lead to an overall failing grade.
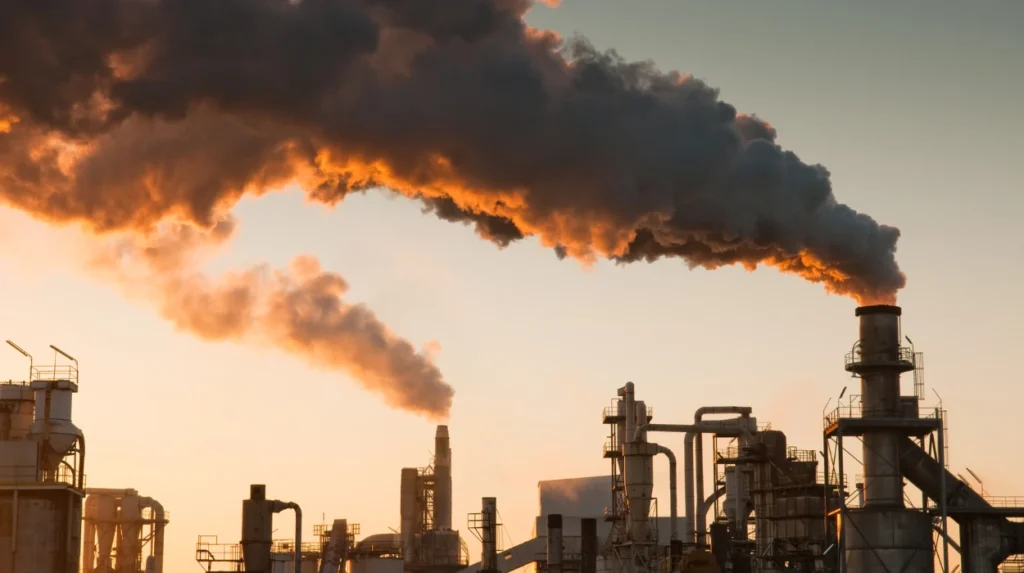
Since 2016, Seattle air quality monitoring data indicate a concerning trend of declining air quality, with both PM2.5 (fine particulate matter) and ozone pollution levels on the rise, reversing a positive trend observed in previous years. The city averages 14.2 unhealthy pollution days annually, which is more than four times the EPA’s recommended limit of 3.2 days per year for each pollutant. Specifically, this includes approximately 7 days of high ozone and 7.2 days of high PM2.5. These pollution spikes are primarily driven by factors such as wildfire smoke, vehicle emissions, and industrial sources.
Air quality matters profoundly in the Pacific Northwest for several reasons. The region’s unique geography, meteorology, and environmental factors can trap pollutants, while external events like distant wildfires have a significant impact. Poor air quality affects daily life, influencing decisions about outdoor activities and even the indoor environment. Moreover, chronic exposure to pollutants poses serious long-term health risks. For instance, a 2008 study focusing on the Duwamish Valley in Seattle uncovered an alarming statistic: an extra 400 cancer cases per 100,000 people were attributed to hyperlocal pollution sources, predominantly from freight truck emissions. This underscores how city-wide “good” readings can mask severe environmental health risks in specific communities. The Puget Sound Clean Air Agency (PSCAA) plays a crucial role in monitoring air pollution across King, Kitsap, Pierce, and Snohomish Counties, with a primary focus on fine particle pollution due to its significant health impact.
Understanding Seattle’s Air Quality Data
To effectively understand and respond to air quality concerns, it’s essential to know how air quality is measured and where to find reliable data. The primary tool for this is the Air Quality Index.
How to Read Air Quality Measurements: The Air Quality Index (AQI)
The U.S. Air Quality Index (AQI) is the Environmental Protection Agency’s (EPA) standard tool for communicating information about outdoor air quality and its potential health effects. The AQI uses six color-coded categories, each corresponding to a specific range of index values and a different level of health concern.
- Green (0-50): Good – Air quality is satisfactory, posing little or no risk.
- Yellow (51-100): Moderate – Air quality is acceptable, but some people, unusually sensitive to air pollution may be at risk.
- Orange (101-150): Unhealthy for Sensitive Groups – Members of sensitive groups may experience health effects, though the general public is less likely to be affected.
- Red (151-200): Unhealthy – Some members of the general public may experience health effects, while sensitive groups may experience more serious health effects.
- Purple (201-300): Very Unhealthy – A health alert is issued, as the risk of health effects is increased for everyone.
- Maroon (301 and higher): Hazardous – A health warning of emergency conditions, where everyone is more likely to be affected.
Generally, an AQI value of 100 aligns with the level of the short-term national ambient air quality standard for public health protection. Values at or below 100 are considered satisfactory, but above 100, air quality becomes unhealthy, initially for sensitive groups and then for everyone as the values climb. The AQI is established for five major air pollutants regulated by the Clean Air Act: ground-level ozone, particle pollution (PM2.5 and PM10), carbon monoxide, sulfur dioxide, and nitrogen dioxide.
Where to Find Reliable Data Sources
Staying informed about real-time air quality in Seattle is crucial. Fortunately, several reliable sources provide up-to-date Seattle air quality monitor readings and air quality forecast Seattle:
- Puget Sound Clean Air Agency (PSCAA): This local agency is a key resource for Puget Sound air quality data, monitoring King, Kitsap, Pierce, and Snohomish Counties. They provide a Fine Particle Sensor Map showing instantaneous pollution levels, as well as data summaries and technical tools for detailed historical information.
- AirNow.gov: The EPA’s federal platform offers current conditions and forecasts for cities nationwide, including Seattle. During wildfire season, their Fire & Smoke Map is an invaluable tool for tracking active fires and smoke plumes.
- Washington Air Quality Map: Provided by the Washington State Department of Ecology, this map offers a broader view of air quality across the entire state, including various types of pollutants from different monitoring stations.
- PurpleAir sensors: These community-based, affordable, and easy-to-install sensors provide hyper-local, real-time data that anyone can access via an interactive map. They complement official networks by quickly identifying pollution hotspots and tracking wildfire smoke movement at a neighborhood level.
- Air Quality WA mobile app: For on-the-go access, this mobile application provides current conditions and forecasts for both Apple and Android devices, making it easy to check air quality wherever you are.
Seasonal Air Quality Challenges
Seattle’s air quality is significantly influenced by seasonal patterns, leading to distinct challenges throughout the year.
Summer Wildfire Smoke Impacts
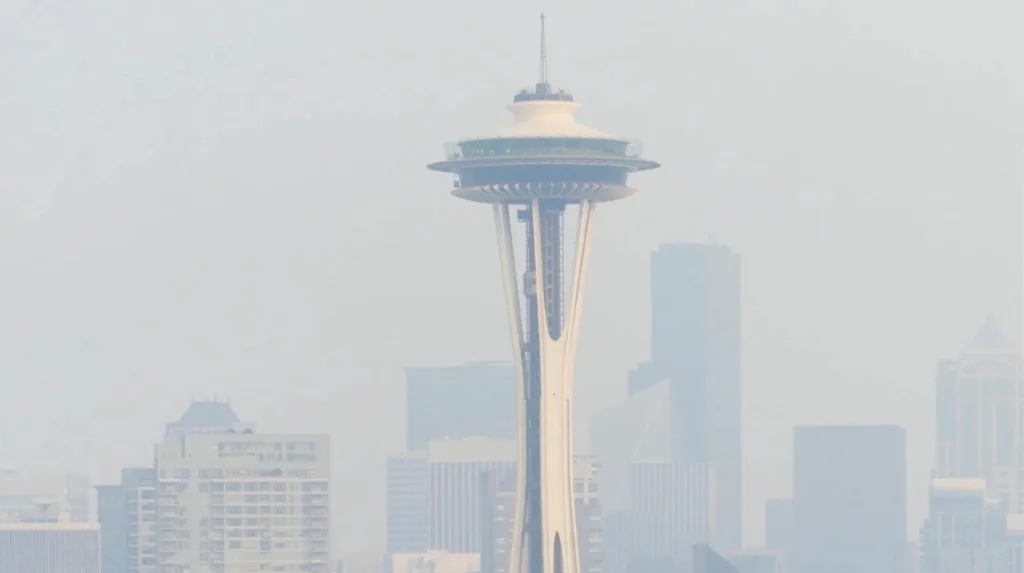
Late summer and early autumn have become particularly challenging seasons for Seattle air quality summer due to wildfire smoke. Fires burning hundreds or even thousands of miles away, often in California or British Columbia, can send plumes of smoke drifting into the Pacific Northwest region. These events can cause dramatic and immediate spikes in PM2.5 levels, turning beautiful, clear days hazy and unhealthy in a matter of hours.
Recent data underscores the severity of this issue:
- The annual average person-days of heavy smoke in the Seattle metro area increased by 440% in 2017-2021 compared to 2011-2015.
- The average person in the Seattle metro area went from experiencing approximately 6 days per year of medium smoke overhead to an average of 8 days per year in the latter half of the decade.
- Similarly, heavy smoke days in the Seattle metro area jumped from about 6 days every four years to roughly 8 days each year.
- August has been identified as a particularly problematic month, being the most polluted month in both 2017 and 2018 due to wildfire impacts.
- The American Lung Association’s “State of the Air” report, which gave Seattle an “F” grade for short-term particle pollution in 2019 (based on 2015-2017 data), specifically cited wildfire smoke as a major contributor to this poor score. These years also ranked among the hottest globally, indicating a link between climate change and increased wildfire activity.
Winter Inversion and Pollution Buildup
As temperatures drop in the winter months, Seattle faces another set of air quality challenges, particularly from Seattle winter air pollution caused by wood burning and atmospheric inversions. Wood stoves and fireplaces, while offering warmth, pump out significant amounts of PM2.5, which exacerbates pollution during this time. The Puget Sound Clean Air Agency has found that PM2.5 levels in winter are approximately 40% higher than in summer, largely due to wood burning combined with temperature inversions.
A temperature inversion occurs when a layer of cold air near the ground is trapped beneath a layer of warmer air higher up, much like a lid placed over a valley. This prevents the normal vertical mixing of air, trapping pollutants close to the surface where people breathe. Calm winds, clear skies, and long nights contribute to these conditions, allowing the ground to cool significantly and the upper atmosphere to warm. In regions with mountainous terrain, like Utah’s Wasatch Mountains, these geographical features can intensify inversions by shielding valleys from stronger winds that could otherwise clear the air. Pollutants from vehicles, wood burning, and industry become concentrated, leading to high AQI values. Most of the PM2.5 in such episodes is formed through chemical reactions in the atmosphere from precursor emissions like nitrogen oxides (NOx), volatile organic compounds (VOCs), sulfur dioxide (SO2), and ammonia (NH3).
Year-Round Air Quality Patterns
Beyond seasonal spikes, Seattle experiences year-round air quality influences. Transportation accounts for nearly half of Seattle’s air pollution, with vehicle emissions, particularly from heavy-duty diesel engines, contributing significantly to particulate matter. Ground-level ozone, a different kind of pollutant from the protective stratospheric ozone layer, forms when pollutants from cars, power plants, and industrial sources react in sunlight. As the climate warms, these reactions occur faster and more frequently, extending what experts refer to as “ozone season”. The ongoing efforts to understand and mitigate these diverse sources are crucial for comprehensive air quality improvement.
Health Impacts & Safety
Poor air quality carries significant health implications, making it crucial to understand the risks and protective measures in Seattle.
Seattle Air Quality Health Effects
Exposure to air pollution can lead to both short-term and long-term health problems:
- Short-term effects include respiratory irritation (such as coughing, shortness of breath, or chest tightness), exacerbation of asthma attacks, and irritation of the eyes, nose, and throat, along with headaches and unusual fatigue.
- Long-term risks from chronic exposure to fine particulate matter (PM2.5) are more severe. These include an increased risk of heart disease and stroke, a contribution to lung cancer development, and the worsening of chronic respiratory diseases like bronchitis and emphysema. In children, prolonged exposure can lead to reduced lung function as they grow. PM2.5 particles are so small (2.5 micrometers across) that they bypass the body’s natural defenses and settle deep in the lungs. The World Health Organization (WHO) reminds us that no level of PM2.5 exposure has been proven completely safe. Breathing ozone also irritates the lungs, causing inflammation similar to a severe sunburn, and can shorten lives.
Who’s Most at Risk
While air pollution affects everyone, certain groups are particularly vulnerable to its harmful effects:
- Children: Their lungs are still developing, and they breathe more air per pound of body weight than adults, making them highly susceptible. A study of 133 children (5-13 years of age) with asthma in the greater Seattle area revealed a clear association between short-term air pollution levels and the occurrence of asthma symptoms.
- A 1-ppm increment in carbon monoxide (CO), lagged by one day, was associated with a 30% increase in the odds of asthma symptoms.
- A 10-microg/m3 increment in the same-day particulate matter < 1.0 microm (PM1.0) was linked to an 18% increase.
- A 10-microg/m3 increment in particulate matter < 10 microm (PM10), lagged by one day, showed an 11% increase.
- When considering the combined effect, an increase in both CO and PM1.0 resulted in a 31% increase in the odds of asthma symptoms.
- Elderly residents often have pre-existing heart or lung conditions that increase their vulnerability.
- Individuals with pre-existing conditions such as asthma, COPD, heart disease, or diabetes are at higher risk during poor air quality days.
- Outdoor workers and those who exercise outside face increased exposure and risk.
- People of color and individuals with lower incomes are disproportionately affected by air pollution, leading to higher risks of illness. The 2008 Duwamish Valley study, linking freight truck emissions to an additional 400 cancer cases per 100,000 people, starkly illustrates how localized pollution creates serious health burdens for specific communities.
When to Limit Outdoor Activities
Protecting one’s health during periods of poor air quality requires proactive measures:
- Check real-time data daily: Make checking resources like AirNow.gov, the PSCAA map, or the Air Quality WA app a regular habit, especially during wildfire season or cold winter spells.
- Limit strenuous outdoor activities: When AQI levels reach unhealthy ranges, it is crucial to reduce physical exertion outdoors, particularly for sensitive individuals.
- Wear a mask: If outdoor activity is unavoidable during poor air quality, consider wearing a high-quality N95 or KN95 mask for protection against fine particles.
- Keep windows and doors closed: This is one of the most effective ways to prevent outdoor pollutants from entering homes, especially during wildfire smoke events or when heavy wood smoke is present.
How Seattle Compares
Understanding Seattle’s air quality in a broader context helps residents grasp its relative standing compared to other areas.
Seattle’s National Ranking
Despite its clean image, Seattle-Tacoma has been identified among cities with significant air pollution issues. In a 2019 report by the American Lung Association, Seattle came in ninth on a list of the worst cities in America for air pollution, specifically for “Short-Term Particle Pollution,” based on data from 2015-2017. The 2020 report further assigned Seattle an “F” grade for both 24-hour PM2.5 and ozone pollution.
Beyond overall grades, Seattle’s specific pollutant rankings are also concerning:
- Seattle ranks 36th worst for high ozone days out of 229 metropolitan areas.
- It ties for 14th worst for particle pollution spikes out of 216 metropolitan areas.
- The city averages 14.2 unhealthy pollution days annually, significantly exceeding the EPA’s recommendation of 3.2 days.
Comparison with Other Major Cities
The broader Pacific Northwest region faces similar challenges, with nine of the top 25 cities with the most polluted air in the United States being located there, according to the 2019 American Lung Association report. For context, Spokane, WA, was ranked 15th on the same list. While not directly compared to Seattle, data from Utah indicates that its Uinta Basin can experience winter ozone concentrations that sometimes surpass those in the largest U.S. cities, highlighting varying regional pollution characteristics. The data used for these comparisons comes from federal, state, and local governments, as well as tribal sources.
Regional Air Quality Context
The Puget Sound Clean Air Agency (PSCAA) is dedicated to monitoring air pollution across King, Kitsap, Pierce, and Snohomish Counties, indicating a regional approach to air quality management. The Washington State Department of Ecology also maintains a comprehensive network of monitoring stations throughout the state. Wildfire smoke, a major contributor to Seattle’s pollution, is inherently a regional issue, with smoke plumes often originating from fires hundreds of miles away in areas like California or British Columbia. The period covered by the 2019 report (2015-2017) included some of the hottest years on record globally, suggesting a link between climate change and the intensity of wildfire seasons affecting the Pacific Northwest.

Solutions & Protection
While the challenges to Seattle’s air quality are significant, there are numerous solutions and protection strategies that can be implemented at personal, household, and community levels.
Personal Protection Strategies
- Stay informed: Regularly check real-time air quality data using resources like AirNow.gov, the PSCAA sensor map, and the Air Quality WA mobile app, especially during periods prone to high pollution (e.g., wildfire season, cold winter spells).
- Limit outdoor exposure: Reduce or avoid strenuous outdoor activities when AQI levels are unhealthy, particularly if you belong to a sensitive group.
- Use masks: If you must be outdoors during periods of poor air quality, consider wearing a high-quality N95 or KN95 mask for respiratory protection.
- Close windows and doors: Prevent outdoor pollutants from entering your home by keeping windows and doors shut when outside air pollution is high, such as during wildfire smoke events or periods of heavy wood smoke. Note that opening windows for ventilation is generally recommended when outdoor air is clean and safe, but not during these high-pollution events.
- Reduce indoor sources: Establish a no-smoking perimeter around doorways and windows, and ensure functional exhaust fans are installed and used in kitchens, bathrooms, and laundry areas to prevent and remove indoor air pollutants. Avoid air fresheners, as they do not remove pathogens and can contribute to poor indoor air quality.
Home Air Quality Improvements
Improving indoor air quality in Seattle is crucial, given that individuals spend approximately 90% of their time indoors. Several technologies and practices can help:
- Heating, Ventilation, and Air Conditioning (HVAC) Systems:
- Optimise your HVAC system by increasing outdoor air intake and using high-efficiency filters. Experts recommend ventilation rates up to 21.2 cubic feet per minute per person, or a minimum of 5 air changes per hour (ACH), to reduce the spread of airborne infectious diseases.
- Use MERV 13 HVAC filters or higher (or their ISO/FPR equivalents), as they capture 30-40% more particles (including pollutants and airborne viruses) than commonly used MERV 8 filters. The all-in cost of upgrading from MERV 8 to MERV 13 for a 5,000 square foot office is estimated at around $1.50 per month.
- Change filters regularly and ensure the entire HVAC system is inspected and cleaned annually to maintain maximum airflow, efficiency, and filtration.
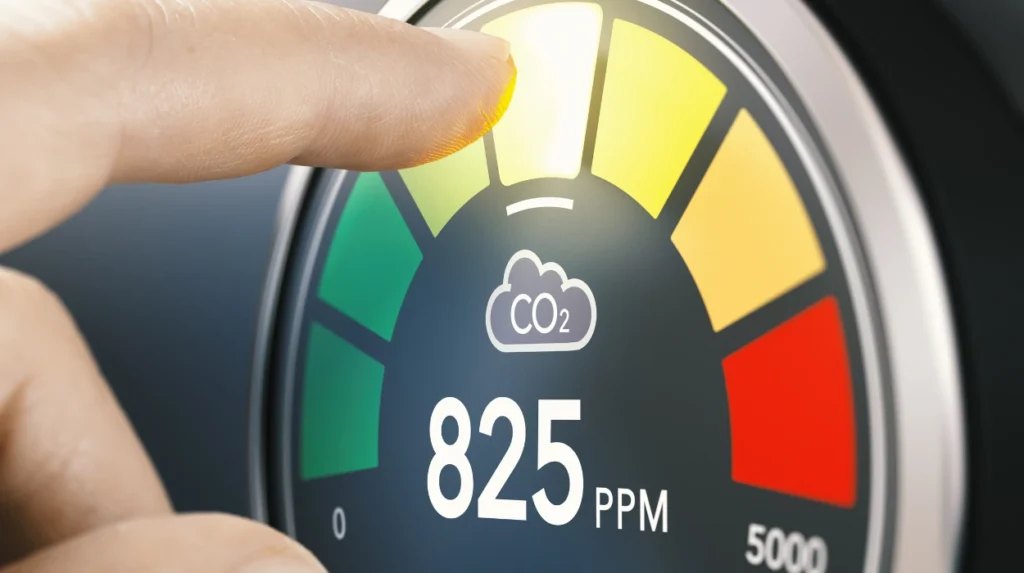
- The CDC recommends increasing ventilation when indoor CO2 levels exceed 800 ppm.
- Portable High Efficiency Particulate Air (HEPA) Air Cleaners:
- These units are highly effective, trapping up to 99.97% of small particles like smog, smoke, allergens, soot, and viruses.
- They are especially useful in spaces without an HVAC system, as a supplement to existing systems, during periods of high outdoor pollution (e.g., wildfire smoke), or in crowded areas.
- Look for “True HEPA” filters that are 99-99.97% effective for particles as small as 0.3 microns, and ensure the unit’s Clean Air Delivery Rate (CADR) is adequate for the room size (e.g., a 500 square foot room with an 8-foot ceiling needs a minimum CADR of 325 cfm).
- Avoid units with additional technologies like ionization or UV lights unless they are third-party verified, as some can generate harmful ozone.
- Place cleaners in high-traffic areas, keep them on, and run them at higher fan speeds for optimal filtration. Regular maintenance, including filter replacement, is critical.
- Box Fan Filters:
- A low-cost, do-it-yourself option, these filter fans use a box fan with a MERV 13 furnace filter attached to clean the air, effectively removing viruses, mold, dust, and wildfire smoke particles.
- The best option for filtering airborne viruses is a Corsi-Rosenthal cube, which uses multiple filters.
- Use in the room where most time is spent, positioned away from walls and dirty areas. Close windows when outdoor pollution is high. Replace filters every three months or after each smoke event.
- Upper Room Ultraviolet Germicidal Irradiation (UVGI):
- These systems kill viruses and microbes in indoor air using UVC light but do not remove particles like exhaust, dust, or smoke.
- Recommended for spaces with limited ventilation or air filtration, but require expert consultation for safe installation due to the dangers of direct UV exposure.
Community and Policy Initiatives
Seattle and King County are implementing various strategies to improve air quality Seattle and mitigate pollution:
- Electric Vehicle (EV) Adoption: Seattle aims for 30% of all privately owned vehicles to be electric by 2030. This is a significant step, as transportation contributes nearly half of the city’s air pollution.
- Public Transit Electrification: King County has an ambitious plan to electrify its entire bus fleet, with all 1,400 county buses becoming electric by 2040.
- Clean Diesel Programs: Since 2001, the city has been tackling pollution from heavy-duty diesel trucks, which disproportionately affect neighborhoods like Georgetown and South Park.
- Waste and Energy Initiatives: Seattle is investing in renewable energy purchasing and working to reduce solid waste emissions by capturing landfill gases and converting them into energy.
- Citizen Science: The rise of community-based Seattle air quality monitoring through PurpleAir sensors empowers residents. These affordable sensors provide hyper-local, real-time data, complementing official government networks by identifying pollution hotspots and tracking smoke plumes at a neighborhood level. This grassroots effort enhances the collective understanding of shared environmental conditions.
From Outdoor Awareness to Indoor Action
The journey through Seattle air quality monitoring reveals a nuanced picture of the Emerald City. Despite its green image, Seattle faces genuine air quality challenges, evidenced by the American Lung Association’s “F” grade and the 14.2 unhealthy pollution days it experiences annually. These facts underscore that the story of Seattle’s air quality extends beyond a simple “eco-friendly” reputation.
The good news is that residents are not powerless. Through dedicated agencies like the Puget Sound Clean Air Agency and innovative grassroots initiatives such as PurpleAir sensors, valuable real-time data is readily accessible. This empowers individuals to make informed decisions, whether it’s checking AirNow.gov before a morning run or using the Air Quality WA app to plan weekend activities.
Crucially, while external factors like wildfire smoke or traffic pollution cannot be fully controlled by individuals, there is significant control over the air within homes. Considering that most people spend approximately 90% of their time indoors, optimising indoor air quality can make the biggest difference for health. Implementing advanced HVAC solutions with superior filtration, utilising portable HEPA air cleaners, or even assembling a DIY box fan filter, can transform a home into a sanctuary of clean, comfortable air. This ensures that, regardless of whether the outdoor AQI indicates “green” or “red,” the indoor environment can remain clean and healthy, protecting what matters most: family health and comfort.